The year of 2016 was notable in that it marked the beginning of a University Of Virginia’s College At Wise study focused on defining microclimates in complex terrain. While a general climate study of the High Knob Massif area has been ongoing for nearly three decades, this project will zero in on local-scale climates across a large vertical elevation range amid complex topography. A long-term project goal being to develop a better understanding of the relationships between microclimate and terrestrial-subterranean biodiversity in heterogeneous terrain.
*The High Knob Massif and its extended landform are ideal for such a study since this is a designated center for the rarity & richness of limited range species in the continental USA ( Precious Heritage ), and is the wettest area in Virginia containing very significant terrestrial & subterranean features.
High Wetland Valleys of High Knob Massif – September 2016
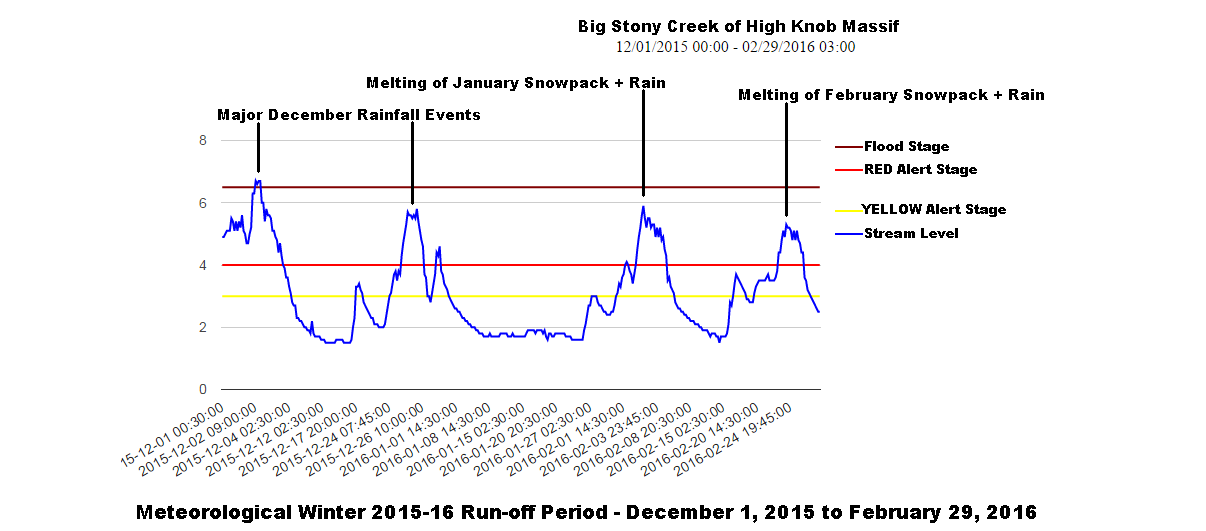
The winter of 2015-16 got off to a slow snow start, with January marking the beginning. However, falls of snow were light in the high country up until the January 22-24 period when a major storm dropped 19.0″ to 28.0″ .
Wind Blown Deep Snow – Eagle Knob of High Knob Massif – January 23, 2016
This was part of a very wet period with rain and snow melt followed by another big dump of snow during February 8-11 when 10″ to 18″ fell from the City of Norton across the high country of the massif.
Big Stony Creek Stream Levels
General 10″ to 20″ snow depths on February 15 increased a little more before milder temperatures and rain triggered yet another big run-off ( above ) from the high country.
Total precipitation during the December-February period of Meteorlogical Winter topped 25.00″ in the upper elevations ( Jan + Feb combining to produce a general 50″ to 80″ of snowfall above 3000 feet elevation in the massif ).
Although January-February snowfall was significant, the 2015-16 season was below average with a general 60-90″ above 3000 feet. By contrast, the previous Winter of 2014-15 produced nearly this much snow just during the month of February ( 56″ to 73″ ).
Winter Majesty In Upper Elevations of High Knob Massif – February 2016
Meteorological Winter 2015-16 precipitation totals at the base of the massif reached 17.85″ in the City of Norton and 19.28″ within South Fork Gorge at the Big Stone Gap Water Plant. Totals lee of the mountains reached 12.67″ in the Tri-Cities.
Yellow Lady’s-slipper Orchid ( Cypripedium parviflorum ) – May 2016
November-April defines the Orographic Forcing Season in the High Knob Massif, with May-October denoting the Convective Season ( May & October often being transitional months with overlap between the two dominant modes ). This break-down forms the MEAN, as I teach it, with variations between years.
March turned atypically quiet with much below average precipitation and only 1-3″ of snow in the high country. April was also drier than average, especially at lower to middle elevations surrounding the massif.
*A general 4.50″ to 5.00″+ of rain fell in the upper elevations during April, with 4.64″ being measured at Big Cherry Dam.
Thunderstorms Build Above The High Country – June 2016
The convective season really got going in May with wetness ruling the May-August period ( at least until mid-August ). Drier and wetter locations existed, with Appalachia Lake on the northwestern flank of the massif having significantly less rainfall than locations within and around the core of the main high country mass.
A general 25.00-30.00″ of rain fell during these 4 months within the High Knob Massif area, to contrast with much drier conditions to the south where only 12.23″ were measured in the Tri-Cities of the Great Valley.
May-August Rainfall Totals
Appalachia Lake Water Plant 18.92″
UVA-Wise NWS Station 19.80″
The Pines Near Dungannon 22.90″
City of Norton Water Plant 25.17″
*Big Cherry Lake Dam 25.80″
Big Stone Gap Water Plant 25.96″
*Rainfall was greater than measured due to evaporation between hand-measurements which average 1 per week ( however only 2 hand-measurement were made during July for more significant evaporation losses from the rain gauge at Big Cherry Dam ).
Autumn In The High Valleys – October 12, 2016
A big shift into dryness occurred as August gave way to September and the beginning of meteorological autumn, with color changes being slowed by above average temps.
The above being relative, of course, to local conditions with high valleys in the massif experiencing the first low-mid 30s during October 9-10, followed by rapid advancement of color changes.
Rugged & Majestic Pickem-Stone Mountain of High Knob Massif – October 16, 2016
September-November Rainfall Totals
UVA-Wise NWS Station 6.00″
The Pines Near Dungannon 6.30″
City of Norton Water Plant 7.62″
Big Stone Gap Water Plant 7.75″
Appalachia Lake Water Plant 8.47″
*Big Cherry Lake Dam 9.87″
*Approximate total with a general 10.00″ to 12.00″ of rainfall across the upper basins of Big Cherry Lake, High Knob Lake and the Norton Reservoirs ( a large percent coming in late November to keep Autumn 2016 from becoming the driest on record ).
Middle Falls of Little Stony Gorge of High Knob Massif – December 2016
A radical pattern change, which began in mid-November really reached its potential late in the month with wetness ruling the mountain landscape throughout December.
December Precipitation Totals
UVA-Wise NWS Station 7.07″
City of Norton Water Plant 7.95″
Appalachia Lake Water Plant 8.02″
Big Stone Gap Water Plant 8.82″
*Big Cherry Lake Dam 10.52″
*Eagle Knob 12.17″
*Approximate totals. The rain gauge at Big Cherry Dam was found busted late in the month due to low temperatures, with this final monthly total being based upon an automated rain gauge and the OBSERVED differences between it and the hand-measured NWS rain gauge in the previous five Decembers at Big Cherry Dam.
The hand-measured NWS rain gauge total reached 10.45″ in December 2015 at Big Cherry Dam. Due largely to orographic forcing, the past decade has found December to be the wettest month of the year with between 8.00″ and 9.00″ of total precipitation on average.
Big Cherry Dam Lake Levels Since November 27, 2016
Going into autumn dryness the lake level was lower than it would have been normally due to a mandated, summer-long water release to help augment flow on the Powell River running downstream toward the Virginia-Tennessee border ( where longer-lived drought existed ).
A tremendous water level rise of 12 vertical feet occurred on Big Cherry Lake during 5 significant rain events between late November and the end of December.
This occurred in wake of a near flat-line representing persistent autumn dryness ( up until late November ).
Majestic Rime Capped Peak of High Knob – December 2016
Although a dozen or so rime formation days occurred in December, the month produced below average snowfall with only around 6″ at most occurring during the month. Much of that fell into December 30 amid wicked winds!
During the past 28 years an average of 19.0″ of snow fell during December in the High Knob-Eagle Knob area of the massif ( * ).
*The absurd 0.5″ during December 2015 being the least observed to contrast with 67.0″ ( if not more ) which buried the high country through December 2010 ( up from the 50.0″ or more that fell during December 2009 ).
December 2016 Climate Statistics High Knob Massif Mesonet
Eagle Knob ( NW Slope ) Elevation 4188 feet
Average Daily MAX: 39.6 degrees Average Daily MIN: 24.8 degrees MEAN Temperature: 32.2 degrees MAX Temperature: 54 degrees MIN Temperature: 4 degrees Total Precipitation: 12.17″ Total Snowfall: 6.0″
High Knob Peak
( Southern Exposure )
Elevation 4101 feet
Average Daily MAX: 40.8 degrees Average Daily MIN: 25.2 degrees MEAN Temperature: 33.0 degrees MAX Temperature: 55 degrees MIN Temperature: 4 degrees
High Knob Lake Basin
Elevation 3527 feet
Average Daily MAX: 40.6 degrees Average Daily MIN: 25.2 degrees MEAN Temperature: 32.9 degrees MAX Temperature: 57 degrees MIN Temperature: 7 degrees
Big Cherry Lake Wetland Valley 1
Elevation 3218 feet
Average Daily MAX: 41.8 degrees Average Daily MIN: 23.6 degrees MEAN Temperature: 32.7 degrees MAX Temperature: 59 degrees MIN Temperature: 6 degrees
Big Cherry Lake Wetland Valley 3
Elevation 3174 feet
Average Daily MAX: 42.3 degrees Average Daily MIN: 23.0 degrees MEAN Temperature: 32.6 degrees MAX Temperature: 59 degrees MIN Temperature: 5 degrees
2016 Precipitation Totals
Orographic forcing played its typical role in the
distribution of precipitation during 2016, as did
convection, with notable enhancements observed
amid the lifting zone of the High Knob Massif.
Majestic Big Cherry Lake of High Knob Massif – August 22, 2016
Totals topped 70.00″ within the upper elevations
across heads of basins containing High Knob Lake,
Big Cherry Lake and the Norton Reservoirs.
Big Cherry Lake Dam ( Elevation 3120 feet )
January 7.43″
February 8.08″
March 2.18″
April 4.64″
May 6.57″
June 5.75″
July 7.70″
August 5.78″
September 3.77″
October 2.26″
November 4.21″
December 10.53″
Total: 68.85″ ( M )
Although the NWS hand-measured rain gauge was supplemented with snow core data during the winter, and with IFLOWS data in periods of lost data, the total for the year is still below what fell due to evaporation between hand measurements & wind induced rain gauge undercatches.
Whitewater ROARS In South Fork Gorge – Big Stone Gap Water Plant – Dec 2016
Big Stone Gap Water Plant ( Elevation 2018 feet )
January 3.54″
February 6.32″
March 1.95″
April 4.41″
May 5.96″
June 5.30″
July 7.38″
August 7.32″
September 3.29″
October 0.67″
November 3.79″
December 8.82″
Total: 58.75″
Whitewater Rapids On Little Stony Creek of High Knob Massif – December 19, 2016
City of Norton Water Plant ( Elevation 2342 feet )
January 4.23″
February 6.91″
March 1.62″
April 3.02″
May 5.50″
June 5.06″
July 8.98″
August 5.63″
September 2.62″
October 1.27″
November 3.73″
December 7.95″
Total: 56.52″
The 2016 total at Norton Water Plant was -1.52″ below the average observed during 1983-2013. During that 31 year period the plant had missing data in the cold seasons from 1983-1998 when a 4″-diameter NWS rain gauge being used was too small to contain the larger falls of snow ( a 8″-diameter NWS rain gauge was put in place at Norton WP during Summer 1998 ). The below average departure for 2016 ( with respect to the past 30+ years ) is somewhat greater than indicated by the -1.52″ value.
Upper Norton Reservoir – October 12, 2016 ( 976 Vertical Feet Higher Than Norton WP )
A couple of NWS Cooperative stations located along the Tennessee Valley Divide, and outside the main lifting zone of the High Knob Massif with respect to prevailing SW air flow trajectories, had much less precipitation in 2016.
University Of Virginia’s College At Wise – NWS Staion ( Elevation 2550 feet )
January 2.90″
February 4.73″
March 1.31″
April 2.80″
May 4.85″
June 3.93″
July 7.37″
August 3.65″
September 2.11″
October 0.84″
November 3.05″
December 7.07″
Total: 44.61″
( -3.39″ below 1981-2010 average )
*A station move from Wise 3 E back to the campus of UVA-Wise occurred with retirement of veteran observer Roy L. Wells, Jr., following more than 50 years of diligent observations, during Spring 2016 ( the NWS station was on the campus of UVA-Wise, formerly called Clinch Valley College, for nearly 40 years ).
Sunset Waves – University Of Virginia’s College At Wise on December 14, 2016
Nora 4 SSE NWS Station Long Ridge of Sandy Ridge ( Elevation 2650 feet )
January 3.02″
February 3.98″
March 1.23″
April 1.97″
May 4.34″
June 7.02″
July 7.20″
August 4.76″
September 1.94″
October 1.03″
November 2.38″
December 5.56″
Total: 44.43″
Nora 4 SSE is located east-northeast of the Wise Plateau along the Tennessee Valley Divide and the adjoining Sandy Ridge Plateau in extreme southern Dickenson County and is operated by observers Wayne & Genevie Riner.
View From Nora 4 SSE On Long Ridge of Sandy Ridge – December 30, 2016


 This occurred in wake of a near flat-line representing persistent autumn dryness ( up until late November ).


