A harsh winter pattern during the February 8-15 period has currently relaxed. This has been a repetitive pattern since mid-January and is illustrated well by build-up and melting of snowpacks amid the High Knob Massif.
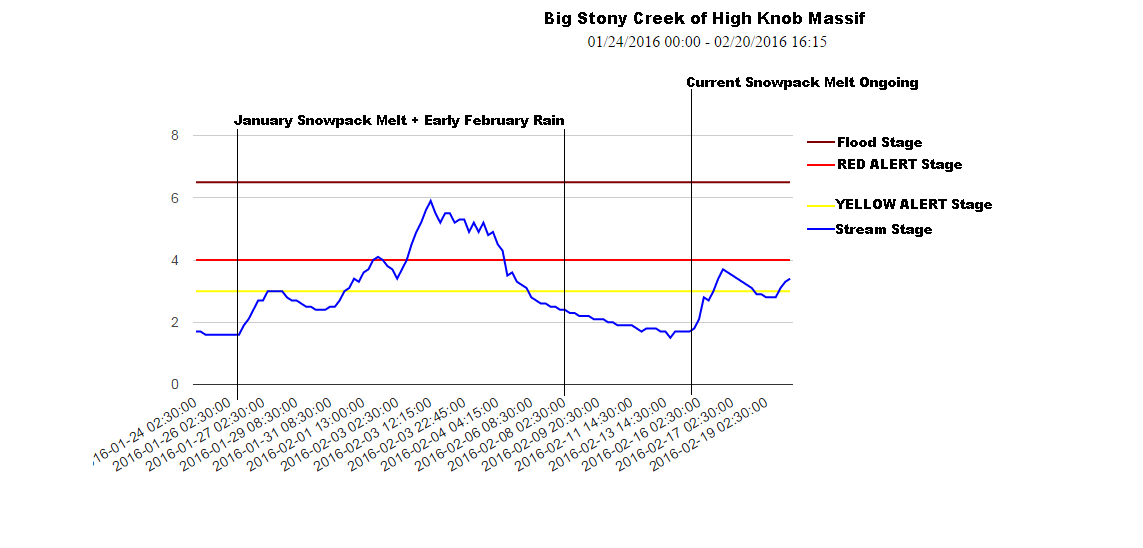
Big Stony Creek Stream Level History – Since January 24, 2016
Whitewater tends to gush when levels reach 2-3 feet, with increasing volume toward RED Alert level resulting in pounding whitewater that ROARS loudly as it plunges along the many steep creeks draining the border area of Wise, Scott, Lee counties.
A long period of enhanced run-off began during the period of January 24 to 26 and continued through the first week of February as snow melt combined with early February rain. Snow depths peaked at 1-2+ feet on January 23-25.
Melt of the current snowpack is ongoing with solid snow still across northern slopes, at upper elevations, late on February 20. Depths peaked between 10″ and 20″ during February 15 at elevations above 3000 feet in the massif.
A mean snow depth of 8″ was measured at the City of Norton Water Plant on February 15, at the northern base of the massif.
Reference Winter Majesty In The High Knob Massif to see actual precipitation totals recorded during this period from Big Cherry Lake Dam & heads of basins for High Knob Lake, Big Cherry, and the Dual Norton Reservoir system.
As noted in my last extended outlook, winter temperatures this season have been correlated to the Arctic Oscillation to a high degree, with negative phases associated with colder than average conditions and positive phases with milder than average temperatures.
Arctic Oscillation History & Short-Term Forecast
Observe that much of January 2016 had a -AO and mean temps were colder than average in the mountain area. The harsh period of February 8-15 is also correlated to a dip back to -AO, with the snowpack melt downs in late January-early February and at the present time associated with +AO phases ( positive phases ).
Naturally, therefore, the future trend of the AO will be of great interest and will likely be associated with how the pattern in the eastern USA trends.
GFS Ensembles Forecast of Arctic Oscillation To March 7, 2016
Both the GFS & GEM ( Canadian ) model ensembles predict that a negative trend in the AO will begin on February 21 and continue through the first week of March ( European Ensembles agree well with these forecasts ).
GEM Ensembles Forecast of Arctic Oscillation To March 7, 2016
Note I use ensembles and look for the MEAN since they tend to be more accurate than any given model run. The indication is solid for a prolonged negative phase of the Arctic Oscillation to occur.
GFS Ensembles Forecast of Pacific North American Oscillation To March 7, 2016
Another strong indicator of a cold pattern redeveloping is the continuation and increase in strength of a +PNA phase which tends to be highly correlated to western USA ridge and eastern USA trough formation.
GEM Ensembles Forecast of Pacific North American Oscillation To March 7, 2016
Note that means of both model ensembles remain positive through the first week of March ( the European Ensembles again agree with this +PNA forecast ).
European Ensembles Forecast 500 MB Height Anomalies – 7 AM February 26, 2016
This western USA ridge and eastern USA trough pattern is very well developed on the European Ensembles by later this week ( Friday, February 26 above ). A cold signal.
In addition, a NW Upslope Flow setting in wake of a strong middle latitude cyclone is likely to result in significant snowfall along the upslope side of the southern-central Appalachians with largely open expanses of water across Lake Michigan & Lake Superior.
European Ensembles Forecast of 850 MB Temp Anomalies – 7 AM February 25, 2016
The 51-Member European Ensembles are, in fact, showing a very cold signal for late this week into the early weekend.
European Ensembles Forecast of 850 MB Temp Anomalies – 7 AM February 26, 2016
Note these temperatures are in degrees Celsius, such that the departure in degrees Fahrenheit is around 20 degrees below average for this time of year by Friday-Saturday ( Feb 26-27 ).
European Ensembles Forecast of 850 MB Temp Anomalies – 7 AM February 27, 2016
There is increased confidence in these forecasts since they are once again correlated to major stratospheric changes via a polar vortex split, with one lobe moving to between eastern Greenland & western European as the other lobe relocates toward western Siberia. This promotes ridging amid the upper air to reinforce the +PNA pattern.
European Model 100 MB Forecast – 7 AM March 1, 2016
The splitting of the Polar Vortex and ridge formation in between the two lobes is illustrated above by the DAY 10 forecast from the European Model ( note that stratospheric forecasts out to DAY 10 tend to be more stable and are often better predicted than a DAY 10 forecast in the troposphere ).
European Model Zonal Mean Temperatures At 7 AM on February 19, 2016
Impacts of this are seen in the Mean Zonal Temperatures with a forecast rise from -85+ degrees Celsius above the North Pole on February 19 to around -55 degrees Celsius above the North Pole by February 29 ( below ), with more warming predicted beyond this point.
This forecast is for a 50+ degree Fahrenheit rise in temperature.
European Model Forecast Zonal Mean Temperatures – 7 AM February 29, 2016
Another graphic illustrating the impacts of this are the zonal mean zonal wind changes through the atmosphere.
European Model Zonal Mean Zonal Wind at 7 AM on February 19, 2016
Observe the lack of easterly flow above the North Pole and the mean Polar Frontal Zone JET Position ( above ) analyzed at 7 AM on February 19 ( around 38 degrees N latitude ).
European Model Forecast Zonal Mean Zonal Wind – 7 AM February 29, 2016
While this may or may not again meet currently accepted technical criteria for a Major Sudden Stratospheric Warming Event ( i.e., reversal of winds at 60 N and 10 MB ), the impacts combine with the previous episode to continue Polar Vortex disturbance and suggests via past climatology that prolonged negative trends in the Arctic Oscillation can be expected for a period of approximately 4-6 weeks. This alone suggests that March will tend to be colder than average in the eastern USA.
In 10 days winds above the North Pole reverse to easterly in direction and the mean Polar Front JET Position has dipped southward to around 30 degrees North Latitude.
European Ensemble Madden-Julian Oscillation Forecast
Although not a huge force this winter, it should be noted that the Madden-Julian Oscillation is also forecast to move into Phase 8 through the first week of March, which is a cold signal for the eastern USA.
The Madden-Julian Oscillation ( MJO ) is a synoptic-scale linkage between the atmosphere and tropical deep convection that unlike the standing wave pattern represented by ENSO takes the form of a traveling wave which propagates through equatorial regions on a 30-90 day period, forming intraseasonal variability with impacts beyond the immediate forcing region of the tropics.
GFS Ensembles Madden-Julian Oscillation Forecast
Yet another signal for cold to dominate into early March.
The Bottom Line
A trend toward colder than average conditions is expected to redevelop this week with redevelopment of a strong western USA ridge and eastern USA trough couplet. A longer term negative trend in the Arctic Oscillation, in wake of continued disturbance of the Polar Vortex, suggests that colder than average weather conditions will likely dominate March.
More arctic outbreaks and snow is likely in coming weeks, set against rising sun angles and longer days, to extend Winter 2015-16 ( sorry Mr. Groundhog )!
A harsh period of winter weather is poised to strike the mountain region during the next 7-14 days. This has been well anticipated by large-scale changes amid the atmosphere across the Northern Hemisphere.
Temperatures above the North Pole at 10 MB have recently been at RECORD high ( warm ) levels for this time of year, having warmed dramatically from near record low ( cold ) values in late December and mid January.
Zonal Mean Temperatures 60-90N Latitude At 10 MB
Zonal Mean Temperatures in the 60-90 degree latitude range at 10 MB have also peaked at record high ( warm ) levels in recent days.
Geopotential Wave 1 Height Amplitude at 60 N and 10 MB
Record strong Wave 1 forcing has been responsible for the dramatically high stratospheric warming in upper levels.
Geopotential Wave 1 Height Amplitude at 60 N and 100 MB
Wave 1 forcing has been strong through the depth of the stratosphere ( near bottom level above ), but clearly has been strongest in upper levels of the stratosphere.
Wave 2 forcing has been weaker than average this winter.
European Model 10 MB Analysis – 7 AM February 7, 2016
A sense for what Wave 1 means can be gained by looking at the European Model’s 10 MB analysis ( above ) at 7 AM on February 7, with dramatic warming over Siberia associated with a single ridge and trough couplet ( High and Low at 10 MB in the Stratosphere ). Upward WAF ( Wave Activity Flux ) from extensive Siberian snow has helped to drive this event along with a favorable large-scale pattern that allows for co-location with the MEAN climatological standing wave pattern of the Northern Hemisphere winter-time, in addition to Torques driven by major mountain barriers.
European Model 10 MB Analysis – January 30, 2016
For comparison, above, I have the 10 MB analysis at 7 AM on January 30. Note that the TEMP MAX is listed at -22 C verses the TEMP MAX of +18 C on the previous 10 MB analysis for February 7. That is a 72 degree F ( 40 C ) increase in temperature in 9 days.
Zonal Mean Zonal Wind at 60 N and 10 MB
Despite dramatic high stratospheric warming, this event has not been able to yet reverse winds at 60 degrees North and 10 MB to meet the technical criteria for a major SSW event ( Sudden Stratospheric Warming ).
There is considerable debate about whether this technical definition for a major SSW event needs to be defined in different terms and/or expanded to also include additional scenarios like this event which has clearly had an important impact upon the Polar Vortex and Northern Hemispheric weather pattern.
European Model Zonal Mean Wind Forecast – 7 AM February 9
The European Model forecast is ever so close to meeting the technical definition, with easterly winds shown at 45 N and 10 MB as well as at 72-90 N and 10 MB but not at the defined 60 N and 10 MB required for the technical declaration of a MAJOR SSW event. So the debate continues.
GFS Ensembles Forecast of Arctic Oscillation
The Arctic Oscillation ( AO ) which has recently been in a positive phase is forecast to trend back negative for a long period of time. Past climatology, following SSW events, show that -AO periods of 4-6 weeks are not uncommon.
Despite the +ENSO in the Pacific, temperatures this winter have been strongly correlated to the phase of the AO.
Recent Arctic Oscillation Phase State & Forecasts
Note above how the AO was mostly in a positive phase from November to the start of January ( when we observed above average temperatures ), then shifted into a negative phase through most of January ( when it was cold ). Recently, the AO has been positive and temperatures have been mild. A very high temp correlation this winter to the AO phases.
GFS Ensembles Forecast of North Atlantic Oscillation
The North Atlantic Oscillation ( NAO ) is also trending back toward a negative-neutral state on the GFS. The ECMWF Ensembles forecast a more negative NAO trend than the GFS ( I am not allowed to show the ECMWF due to rights established by the European Center For Medium Range Forecasting which require a very costly license ).
GFS Ensembles Pacific North American Oscillation Forecast
A positive Pacific North American ( +PNA ) oscillation phase is predicted to continue, and become very strong in the next few days as a big western North American ridge builds.
The Eastern Pacific Oscillation ( EPO ) is forecast to remain in a negative phase through most of this week, then become positive before dropping again later. Recall last winter that temperatures had a high correlation to the EPO phase.
*Temperatures in the eastern USA almost always tending to have correlation to the PNA phase of various degrees, with western USA ridging naturally correlating to downstream troughing ( and visa versa ), with variations in tilt and amplitude at any given time.
In basic summary, all teleconnection phases are coming into alignment for an arctic outbreak this week with a prolonged negative AO phase upcoming to suggest that colder than average conditions will continue.
**It is very important to again stress that teleconnections are not driving these changes, but instead are in response to large-scale changes and allow us to be able to more clearly predict what such changes may do in the near future to a given weather pattern.
European Model 100 MB Forecast at DAY 10
The European Model 100 MB stratospheric forecast ( which I can show ) is supporting this via ridge building and blocking in the North Atlantic into Greenland, and a vortex split and orientation that is acting to drive cross-polar flow from Siberia through Canada into the eastern USA.
This vortex split being only visible up to around 50 MB at 10 day, with the big change in orientation of the Polar Vortex and the pronounced North Atlantic ridge near Greenland being most important and pronounced.
European Model 150 MB Forecast At DAY 10 ( February 16, 2016 )
A pattern that is simply primed for delivery of bitterly cold air ( late season ) into the region during the next 7-10 days. Any snow on the ground will act to make this colder.
During the next 10 days the European Model snow forecast is predicting a general 6″ to 16″ to fall along the upslope side of the Appalachians ( with respect to W-NW flow ).
The problem, of course, this is based upon 10:1 snow densities and the upcoming cold will make snow density much lower. Amounts in such a setting could easily be 2-3 times as great. Climatology of past settings like this certainly supports such amounts, especially amid upper elevations in the High Knob Massif and other of the most favored sites such as Snowshoe Mountain in West Virginia, Mount LeConte in Tennessee & Mount Mitchell in North Carolina.
Snowfall will be over a prolonged period of time, and not associated with a single dump. With that noted, the El Nino enhanced subtropical jet is not dead by any means. Merely suppressed to the south. So danger remains that a phasing event between the sub-tropical and polar jets will again occur as happened during January. It is very difficult to say when that might occur, with the most likely time currently being around and just after mid-February when arctic air begins to relax ( allowing the sub-tropical stream a potential entrance into more northern latitudes ).
The Bottom Line…Winter 2015-16 has a great amount of “gas” left in the tank, with a period of harsh winter conditions likely to develop this week into this next weekend. The strong +ENSO event of this winter has not been typical and nothing like that of 1997-98.
Snowfall during the next 1-2+ weeks could be significant, with total amounts that fall likely being greater than depths at any given time due to melting, sublimation, and settlement of snow on the ground over time ( if you want an accurate snowfall reading, then measure and sweep the snow every 6 hours to obtain 4 amounts to add up for each 24-hour total ).
As always, there are likely to be “wrinkles” and changes in this pattern that are not currently seen. The +ENSO jet adds complexity, with fluctuations in the timing of all embedded disturbances in arctic, polar, sub-tropical streams acting to play a role in the type of weather experienced on any given day. This extended is only a general guide to be used for the synoptic ( i.e., large-scale ) pattern, with details of any given day having to be worked out.